
Common Statistics Interview Questions Part -1
Let's understand them clearly One at a time!!

Do you want to nail statistics in Data science or ML interview?
The initial interview rounds focus on statistics (depending on the role you are applying for). But Nonetheless, these are the most frequently asked statistical questions covered in this part(1)
P-value
Hypothesis testing
Null hyp/Alternate Hyp
t-test,z-test
Type of Errors(Type 1 vs Type 2)
Central limit theorem
Correlation vs Causation
Confidence Interval
Statistical power and significance level
Let’s explore them one at a time!
P- Value :
The p-value measures the strength of evidence against the null hypothesis in hypothesis testing.
Null hypothesis and Alternate hypothesis:
Hypothesis testing is a method to make inferences about a population based on sample data.
Null Hyp: The null hypothesis is a statement of no effect or no difference.
eg: This drug has no effect/difference even with the new formula.
Alternate Hyp: Suggest that there is a specific effect, relationship, or difference in the population.
eg: This drug has an effect/ relationship with the new formula
Alternate Hyp has two types of effects:
1) One-tailed or one-sided: It states the effect/difference in a specific direction.
eg: The drug has a negative effect or positive effect on the population mean
2) Two-tailed or two-sided: It states the effect/difference in both directions.
eg: The drug can have both positive and negative effects on the population mean.
if p-value < alpha → Reject Null Hyp
if p-value>= alpha → Accept Alternate Hyp
But, How do you calculate the p-value? What are the general steps to do so??
1)Formulate Hypothesis(Setup Null and Alternate Hypothesis)
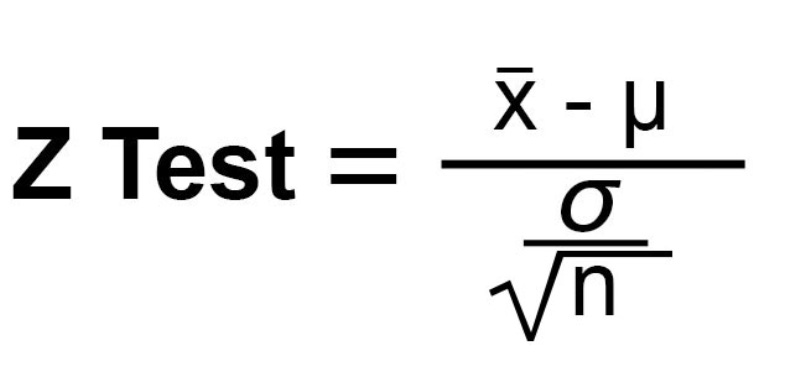
2)Calculate test statistic(ztest or t test statistic)
It can be calculated using the formula below. It can be a t-test as well if the sample size is less and the sample mean doesn’t follow a normal distribution.
3)Find the Critical Region (Rejection Region):
Determine critical values from the Z distribution table or t distribution table. The critical region consists of the extreme tails of the t-distribution where we would reject the null hypothesis. Below is an example for one-tailed assuming Null hyp is True.
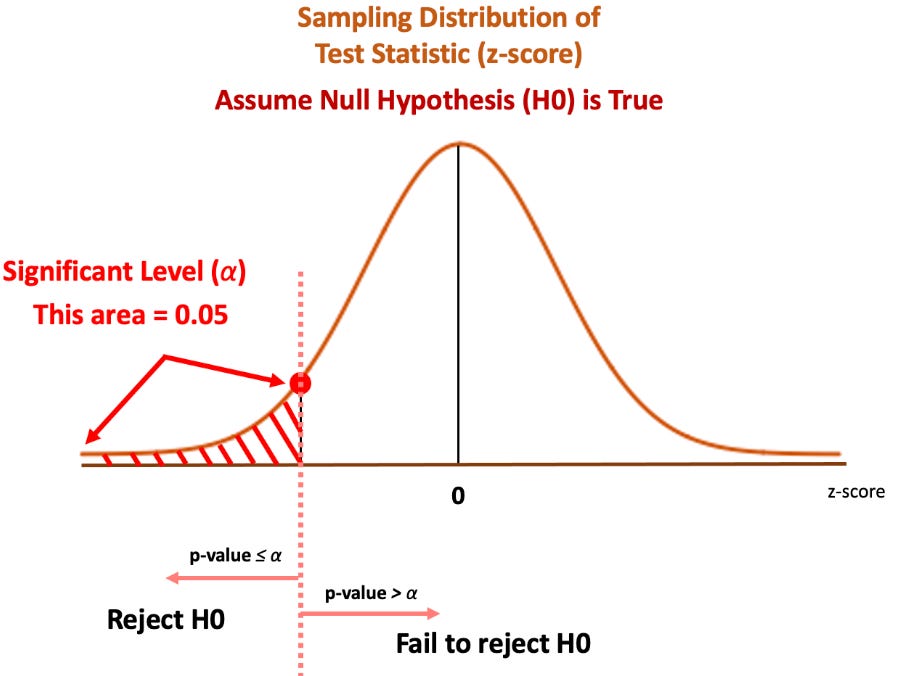
For More details and examples watch the video. Credits to the owner.
z-test vs t-test? When to use what for hypothesis testing?
z-test:
1.) applied when sample size(n) is greater than 30.
2.) The sample mean follows a normal distribution(due to the central limit theorem)
3)If the population standard deviation (σ) is known, then z-test can be used to compare the sample mean to the population mean.
t-test
1.) applied when sample size(n) is less than 30 or small.
2.) The sample mean doesn't follow a normal distribution.
3)If the population standard deviation (σ) is unknown, the t-test can be used to estimate the population mean based on the sample mean.
Correlation and Causation?
Correlation: Correlation measures the statistical relationship between two variables. It quantifies the strength and direction of the linear association between variables. However, correlation does not imply causation. Just because two variables are correlated does not mean that one variable causes the other to change. Correlation indicates a relationship, but it does not reveal the underlying mechanism.
Causation: Causation refers to a cause-and-effect relationship between variables. It suggests that changes in one variable directly cause changes in another variable. Establishing causation requires more rigorous analysis, such as conducting controlled experiments, considering temporal order, ruling out confounding variables, and applying other causal inference techniques.
Confidence Interval
It provides a range of values within which the true population parameter is likely to fall with a certain level of confidence. It quantifies the uncertainty associated with estimating population parameters based on sample data.
Let us take an example,
A 95% confidence interval for a population mean represents a range of values within which we can be 95% confident that the true population mean lies.
Range: The confidence interval provides a lower and upper bound, defining the range of plausible values for the population parameter. For example, a 95% confidence interval for a mean might be [x, y]. This means that we are 95% confident that the true population mean falls within this range [x, y].
Confidence Level: The confidence level ( 95% in this case) represents the probability that the calculated confidence interval captures the true population parameter if we were to repeat the sampling process many times.
Central Limit theorem
The Central Limit Theorem (CLT) states that, regardless of the shape of the population distribution, the sampling distribution of the sample mean approaches a normal distribution as the sample size increases. In other words, if you take repeated random samples from a population and calculate the mean of each sample, the distribution of those sample means will be approximately normal.
Type of Errors(Type 1 vs Type 2)
Type 1 errors- False Positives
When you reject the null hypothesis when it is actually True
eg: If mistakenly reject the null hypothesis and conclude that the drug is effective in curing disease when in reality, the drug has no effect.
The probability of committing a Type I error is denoted by alpha (α), which is the chosen significance level in hypothesis testing.
Type 2 errors - False negatives
when you incorrectly fail to reject the Null Hypothesis when it is False( we fail to detect real effect)
eg: If the drug is effective, but it is incorrectly identified as not effective
The probability of committing a Type II error is denoted by beta (β), and it is related to the statistical power of the test (power = 1 - β).

The relation between statistical power and hypothesis is clearly summarized in this image
Consider a world where Null Hyp is true which is left plotted in the image above and for the alternate Hyp to be true (which is right plotted. Consider the mean(μ) is a little higher than expected!).
For a specific significance level set (alpha) for the null hypothesis, the more the significance level the higher the statistical power(1 - β). As the significance level(alpha) increases the area under the curve increases for alpha and the line represented by alpha moves towards the left which results in more area for (1 - β) region which is statistical power
For video explanation refer to khan academy!
Consider subscribing for more data science updates and do share if you find it helpful